Physics Toolbox Sensor Suite P

4.9star
996 reviews
10K+
Downloads

Everyone
info


About this app
This app uses internal smartphone sensors to collect, display, record, and export .csv data files. See www.vieyrasoftware.net to (1) read about case usage in research and development, and (2) get lesson plans for educators of science, technology, engineering, and mathematics (STEM) fields, including physics. Sensor availability, precision, and accuracy are dependent upon smartphone hardware.
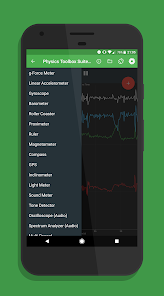
Sensors, generators, and data analysis tools include the following:
KINEMATICS
G-Force Meter - ratio of Fn/Fg (x, y, z and/or total)
Linear Accelerometer – acceleration (x, y, and/or z)
Gyroscope - radial velocity (x, y, and/or z)
Inclinometer - azimuth, roll, pitch
Protractor - angle from vertical or horizontal
ACOUSTICS
Sound Meter - sound intensity
Tone Detector - frequency and musical tone
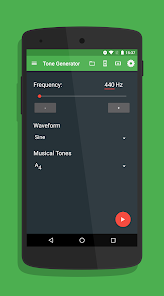
Tone Generator – sound frequency producer
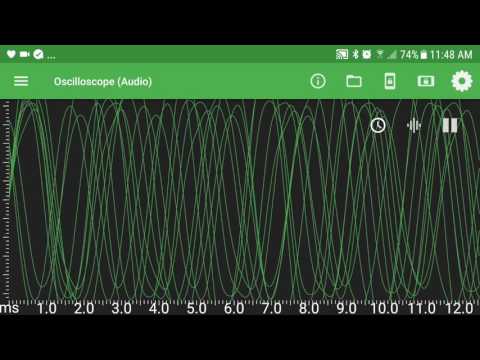
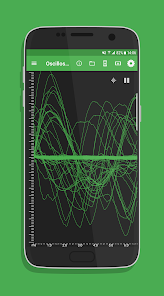
Oscilloscope - wave shape and relative amplitude
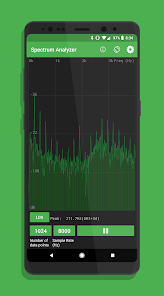
Spectrum Analyzer - graphical FFT
Spectrogram - waterfall FFT
LIGHT
Light Meter - light intensity
Color Detector - detects HEX colors within a small rectangle area on the screen via the camera.
Color Generator – R/G/B/Y/C/M, white, and custom color screen
Proximeter - periodic motion and timer (timer and pendulum modes)
Stroboscope (beta) - camera flash
Wi-Fi - Wi-Fi signal strength
MAGNETISM
Compass - magnetic field direction and bubble level
Magnetometer - magnetic field intensity (x, y, z and/or total)
Magna-AR - augmented reality visualization of magnetic field vectors
OTHER
Barometer - atmospheric pressure
Ruler - distance between two points
GPS - latitude, longitude, altitude, speed, direction, number of satellites
System Temperature - battery temperature
COMBINATION
Multi Record - choose one or more of the above sensors to collect data at the same time.
Dual Sensor - display data from two sensors on a graph in real time.
Roller Coaster - G-Force Meter, Linear Accelerometer, Gyroscope, and Barometer
PLOTTING
Manual Data Plot - enter data manually to generate a graph.
GAME
Play - challenges
FEATURES
(a) Record: Record by pressing the red floating action button. Find saved data stored in the folder icon.
(b) Export: Export data by selecting an option to send via e-mail or shared in Google Drive or Dropbox. Locally saved files can also be transferred from the folder icon.
(c) Sensor Information: Clicking on the (i) icon to identify sensor name, vendor, and current data collection rate, and to learn what kind of data is collected by the sensor, its physical operating principle, and links to additional resources.
SETTINGS
* Note that not all settings are available for all sensors.
(a) Data Display: View data in graphical, digital, or vector form.
(b) Graph Display: View multi-dimensional data sets on a single shared graph or in multiple individual graphs.
(c) Displayed Axis: For multi-dimensional data on a single shared graph, select total, x, y, and/or z-axis data.
(d) CSV Timestamp Format: Record clock time or elapsed time with sensor data.
(e) Line Width: Modify visual presentation of data with a Thin, Medium, or Thick line.
(f) Sensor Collection Rate: Set collection rate as Fastest, Game, UI, or Normal. The sensor collection rate is displayed for each option when selected.
(g) Keep the Screen On: Prevent the app from turning the screen off automatically.
(h) Calibrate: Calibrate selected sensors.
Sensors, generators, and data analysis tools include the following:
KINEMATICS
G-Force Meter - ratio of Fn/Fg (x, y, z and/or total)
Linear Accelerometer – acceleration (x, y, and/or z)
Gyroscope - radial velocity (x, y, and/or z)
Inclinometer - azimuth, roll, pitch
Protractor - angle from vertical or horizontal
ACOUSTICS
Sound Meter - sound intensity
Tone Detector - frequency and musical tone
Tone Generator – sound frequency producer
Oscilloscope - wave shape and relative amplitude
Spectrum Analyzer - graphical FFT
Spectrogram - waterfall FFT
LIGHT
Light Meter - light intensity
Color Detector - detects HEX colors within a small rectangle area on the screen via the camera.
Color Generator – R/G/B/Y/C/M, white, and custom color screen
Proximeter - periodic motion and timer (timer and pendulum modes)
Stroboscope (beta) - camera flash
Wi-Fi - Wi-Fi signal strength
MAGNETISM
Compass - magnetic field direction and bubble level
Magnetometer - magnetic field intensity (x, y, z and/or total)
Magna-AR - augmented reality visualization of magnetic field vectors
OTHER
Barometer - atmospheric pressure
Ruler - distance between two points
GPS - latitude, longitude, altitude, speed, direction, number of satellites
System Temperature - battery temperature
COMBINATION
Multi Record - choose one or more of the above sensors to collect data at the same time.
Dual Sensor - display data from two sensors on a graph in real time.
Roller Coaster - G-Force Meter, Linear Accelerometer, Gyroscope, and Barometer
PLOTTING
Manual Data Plot - enter data manually to generate a graph.
GAME
Play - challenges
FEATURES
(a) Record: Record by pressing the red floating action button. Find saved data stored in the folder icon.
(b) Export: Export data by selecting an option to send via e-mail or shared in Google Drive or Dropbox. Locally saved files can also be transferred from the folder icon.
(c) Sensor Information: Clicking on the (i) icon to identify sensor name, vendor, and current data collection rate, and to learn what kind of data is collected by the sensor, its physical operating principle, and links to additional resources.
SETTINGS
* Note that not all settings are available for all sensors.
(a) Data Display: View data in graphical, digital, or vector form.
(b) Graph Display: View multi-dimensional data sets on a single shared graph or in multiple individual graphs.
(c) Displayed Axis: For multi-dimensional data on a single shared graph, select total, x, y, and/or z-axis data.
(d) CSV Timestamp Format: Record clock time or elapsed time with sensor data.
(e) Line Width: Modify visual presentation of data with a Thin, Medium, or Thick line.
(f) Sensor Collection Rate: Set collection rate as Fastest, Game, UI, or Normal. The sensor collection rate is displayed for each option when selected.
(g) Keep the Screen On: Prevent the app from turning the screen off automatically.
(h) Calibrate: Calibrate selected sensors.
Updated on
Safety starts with understanding how developers collect and share your data. Data privacy and security practices may vary based on your use, region, and age. The developer provided this information and may update it over time.

No data shared with third parties
Learn more about how developers declare sharing

This app may collect these data types
App info and performance

Data isn’t encrypted
Data can’t be deleted
Ratings and reviews
4.9
970 reviews

Germano Forti Junior
- Flag inappropriate
July 3, 2023
This is the app I was looking for to record data from the phone sensors and have analysis offline. It is impressive that it can record raw data with a good sample rate. I see the sample rate varies on the recorded data and I guess that might be related to the phone processing power, but still great and fast enough for what I need. I don’t see any ads on the free version and don’t know what the pro version does, but I will buy the pro version with satisfaction. Congratulations on your work.
9 people found this review helpful

A Google user
- Flag inappropriate
- Show review history
March 4, 2019
This app is an easy and effective way to transform the sensors in your phone into a versatile tool set. I used the magnetometer, for example, during my doctoral research at Penn State to map out the geomagnetic field of our vacuum chamber. I used the accelerometer while teaching to measure vibrations during structural tests of students' designs. At NASA, I've used the audio spectrogram to identify faulty pumps. And for personal use, I've used the audio spectrogram to identify birds in my backyard and the tone generator to tune my instruments. And, this app is essential for the curios who just wants to know more about the physical world around him or her. The graphical interface is not pleasing and sometimes confusing, but the app is very stable and reliable. Vieyra team is very response to emails, and gladly takes feature requests. EDIT: typos
31 people found this review helpful
Vieyra Software
March 7, 2019
Thank you very much for the feedback.

Stefan Hudson
- Flag inappropriate
- Show review history
January 14, 2021
Terrific app, gives access to the raw data coming from all of the sensors. I last used it to detect the magnetic field fluctuations produced by a water meter while troubleshooting a Flume sensor - it produced an impressively clean signal. Some suggestions for the developers: 1) Make it more obvious when data is being recorded, like change the color of the record button or screen border (i.e., only red while actually recording). I lost some data a couple times because I thought it was recording when it wasn't - it can be tricky see the screen in detail when collecting data sometimes. 2) When the app is re-opened, go back to the same sensor it was in previously. 3) Make an easy way to generate an FFT of data recorded from any channel - for the water meter, it would have been nice to be able to get a read of the frequency of the magnetometer data. This could also be useful as a tachometer for motors, etc.
32 people found this review helpful
Vieyra Software
January 15, 2021
Thank you for the feedback. We have been curious to try to measure the magnetic field changes of the water meter too! We really appreciate your three points of feedback. We are sorry to hear you lost some data as the UI was not clear enough for you to know that data was not being recorded. Feel free to write to us at support@vieyrasoftware.net
What's new
Bug fixes


