

Cbonds App

10K+
Downloads

Everyone
info


About this app
Cbonds is an information environment for financial market professionals and investors.
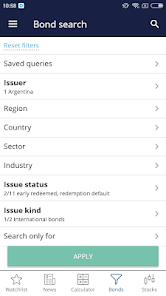
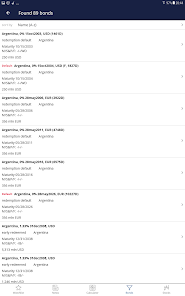
The application provides a quick search facility for stocks, bonds and indices, as well as popular analytical tools.
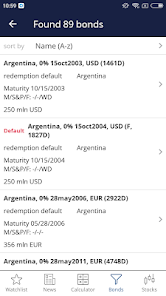
The Cbonds database contains more than 650,000 bond and Eurobond issues worldwide, 75,000 shares, 30,000 indices on stock markets, bonds, the commodity market and macroeconomics.
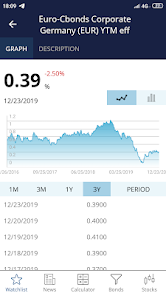
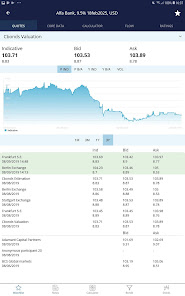
The bond page contains data on current and archival quotes and yields on the stock exchange and over-the-counter market from market participants. Basic information about each issue is also presented: issue status, issue volume, coupons and payment schedule, placement and repayment dates, credit ratings, identification information, issue placement data and other parameters.
The trading schedule, basic parameters, dividend payment schedule, information about the issuer, holders, and news are available on the stock page.
On the index page you can find a graph of its values, the calculation method and a list of the papers necessary for its calculation.
On the issuer's page, you can get all the information available on Cbonds on a particular issuer: general information, ratings, and reporting.
The key functionality of the Watchlist application allows you to track information and quotes on a selected list of bonds, shares and indices. The list is added via a search in the Watchlist section or through the bond, stock, or index pages.
In the Bond Calculator you can calculate the analytical indicators used in the valuation of bonds and Eurobonds. The tool allows you to calculate clean and dirty prices, accrued coupon interest (ACI), several types of bond yields, debt, as well as indicators of modified duration, convexity, PVBP, G-spread, and Z-spread, which allows you to analyze the volatility of debt market instruments and to evaluate changes in the bond price when the yield changes.
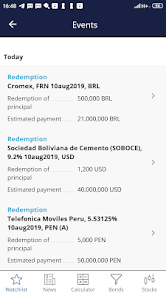
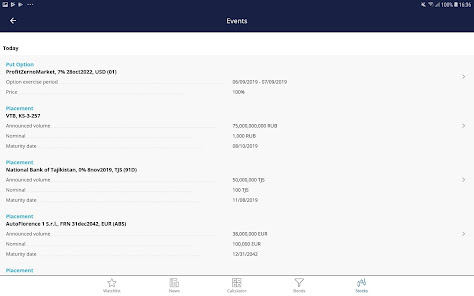
The event calendar allows you to filter bond events by geographic location, as well as by event type, issue and issuer for a certain period.
In the app you can build a market map based on your Watchlist, view your market maps or use pre-configured ready-made maps. There’s also a section on interest-rate curves.
In a separate section of the application and on the issuers pages, there is a list of financial news that can be searched.
We invite you to use our application and will be glad to hear your feedback!
The application provides a quick search facility for stocks, bonds and indices, as well as popular analytical tools.
The Cbonds database contains more than 650,000 bond and Eurobond issues worldwide, 75,000 shares, 30,000 indices on stock markets, bonds, the commodity market and macroeconomics.
The bond page contains data on current and archival quotes and yields on the stock exchange and over-the-counter market from market participants. Basic information about each issue is also presented: issue status, issue volume, coupons and payment schedule, placement and repayment dates, credit ratings, identification information, issue placement data and other parameters.
The trading schedule, basic parameters, dividend payment schedule, information about the issuer, holders, and news are available on the stock page.
On the index page you can find a graph of its values, the calculation method and a list of the papers necessary for its calculation.
On the issuer's page, you can get all the information available on Cbonds on a particular issuer: general information, ratings, and reporting.
The key functionality of the Watchlist application allows you to track information and quotes on a selected list of bonds, shares and indices. The list is added via a search in the Watchlist section or through the bond, stock, or index pages.
In the Bond Calculator you can calculate the analytical indicators used in the valuation of bonds and Eurobonds. The tool allows you to calculate clean and dirty prices, accrued coupon interest (ACI), several types of bond yields, debt, as well as indicators of modified duration, convexity, PVBP, G-spread, and Z-spread, which allows you to analyze the volatility of debt market instruments and to evaluate changes in the bond price when the yield changes.
The event calendar allows you to filter bond events by geographic location, as well as by event type, issue and issuer for a certain period.
In the app you can build a market map based on your Watchlist, view your market maps or use pre-configured ready-made maps. There’s also a section on interest-rate curves.
In a separate section of the application and on the issuers pages, there is a list of financial news that can be searched.
We invite you to use our application and will be glad to hear your feedback!
Updated on
Safety starts with understanding how developers collect and share your data. Data privacy and security practices may vary based on your use, region, and age. The developer provided this information and may update it over time.


What's new
In the new version of the Cbonds mobile app, we have updated information about participants in the "Parameters" section on the bond page; we have moved the Watchlist market map to the "Custom" subgroup; changed the period buttons on index charts; a notification about adding a security to WL on the stock page, and bonds has been added; bug fixing.
Thank you for using the Cbonds mobile app!
Thank you for using the Cbonds mobile app!